'%3e%3cpath id='Path_78' data-name='Path 78' d='M1231.387%2c253.519c-3.705-3.621-10.085-3.474-17.475-3.3-1.694.039-3.446.08-5.252.08-2.256%2c0-4.42-.086-6.514-.168-7-.274-13.045-.513-16.639%2c2.941-2.412%2c2.319-3.585%2c6.212-3.585%2c11.9%2c0%2c5.393%2c1.15%2c9.139%2c3.518%2c11.452%2c3.705%2c3.621%2c10.086%2c3.474%2c17.474%2c3.3%2c1.694-.039%2c3.446-.08%2c5.253-.08%2c2.256%2c0%2c4.42.085%2c6.514.168%2c1.852.073%2c3.636.143%2c5.327.143%2c4.7%2c0%2c8.668-.544%2c11.311-3.085%2c2.413-2.319%2c3.585-6.211%2c3.585-11.9C1234.9%2c259.577%2c1233.755%2c255.832%2c1231.387%2c253.519Zm-.674%2c22.719c-3.325%2c3.2-8.918%2c2.975-16%2c2.7-2.1-.082-4.275-.168-6.548-.168-1.817%2c0-3.574.041-5.273.08-7.487.173-13.4.31-16.842-3.052-2.19-2.14-3.254-5.68-3.254-10.825%2c0-5.437%2c1.085-9.122%2c3.316-11.268%2c3.325-3.2%2c8.919-2.975%2c16-2.7%2c2.1.083%2c4.276.168%2c6.549.168%2c1.817%2c0%2c3.574-.04%2c5.273-.08%2c7.487-.173%2c13.4-.31%2c16.842%2c3.053%2c2.19%2c2.139%2c3.254%2c5.679%2c3.254%2c10.824C1234.029%2c270.407%2c1232.944%2c274.093%2c1230.713%2c276.238Z' transform='translate(-1181.922 -239.039)'%3e%3c/path%3e%3cpath id='Path_79' data-name='Path 79' d='M1229.229%2c246.046c-3.479-2.38-8.5-3.489-15.809-3.489-11.45%2c0-22.628%2c1.422-22.628%2c18.425%2c0%2c7.138%2c2.069%2c12.024%2c6.326%2c14.937%2c3.479%2c2.381%2c8.5%2c3.489%2c15.81%2c3.489%2c11.45%2c0%2c22.629-1.422%2c22.629-18.426C1235.556%2c253.844%2c1233.486%2c248.959%2c1229.229%2c246.046Zm-16.3%2c32.487c-11.042%2c0-21.26-2.127-21.26-17.551%2c0-16.207%2c10.289-17.549%2c21.752-17.549%2c11.042%2c0%2c21.26%2c2.127%2c21.26%2c17.549C1234.68%2c277.19%2c1224.39%2c278.533%2c1212.927%2c278.533Z' transform='translate(-1186.682 -235.052)'%3e%3c/path%3e%3cpath id='Path_80' data-name='Path 80' d='M1218.178%2c234.457c-11.25%2c0-18.52%2c8.705-18.52%2c22.178%2c0%2c13.266%2c7.245%2c22.179%2c18.027%2c22.179%2c11.25%2c0%2c18.52-8.705%2c18.52-22.179C1236.206%2c243.37%2c1228.961%2c234.457%2c1218.178%2c234.457Zm-.492%2c43.481c-10.259%2c0-17.151-8.561-17.151-21.3%2c0-12.941%2c6.925-21.3%2c17.643-21.3%2c10.259%2c0%2c17.151%2c8.561%2c17.151%2c21.3C1235.33%2c269.576%2c1228.4%2c277.938%2c1217.686%2c277.938Z' transform='translate(-1191.441 -230.705)'%3e%3c/path%3e%3cpath id='Path_81' data-name='Path 81' d='M1222.938%2c226.358c-3.9%2c0-7.578%2c2.983-10.368%2c8.4a39.516%2c39.516%2c0%2c0%2c0-4.042%2c17.531c0%2c10.6%2c4.957%2c25.932%2c13.918%2c25.932%2c3.9%2c0%2c7.578-2.983%2c10.368-8.4a39.509%2c39.509%2c0%2c0%2c0%2c4.043-17.531C1236.857%2c241.69%2c1231.9%2c226.358%2c1222.938%2c226.358Zm-.492%2c50.987c-3.646%2c0-7.03-2.988-9.527-8.412a41.8%2c41.8%2c0%2c0%2c1-3.515-16.644c0-11.827%2c5.788-25.055%2c13.534-25.055%2c3.646%2c0%2c7.03%2c2.988%2c9.528%2c8.413a41.8%2c41.8%2c0%2c0%2c1%2c3.515%2c16.643C1235.981%2c264.116%2c1230.192%2c277.344%2c1222.446%2c277.344Z' transform='translate(-1196.201 -226.358)'%3e%3c/path%3e%3c/g%3e%3c/svg%3e)
'%3e%3cg transform='translate(1235.906 232.606)'%3e%3cpath d='M1343.067%2c255.169h1.652l-.012%2c2.917c.365-1.823%2c2.735-3.282%2c7.11-3.282%2c5.47%2c0%2c7.657%2c2.552%2c7.657%2c8.022V273.4h-1.823v-9.48c0-5.834-1.641-7.293-6.381-7.293-5.47%2c0-6.381%2c2.443-6.381%2c7.293v9.48h-1.823Z' transform='translate(-1343.067 -251.523)'%3e%3c/path%3e%3cpath d='M1410%2c265.744v-2.917c0-5.287%2c1.823-8.022%2c8.386-8.022s8.386%2c2.735%2c8.386%2c8.022v2.917c0%2c5.469-1.823%2c8.022-8.386%2c8.022S1410%2c271.213%2c1410%2c265.744Zm14.95%2c0v-2.917c0-4.193-.839-6.2-6.563-6.2s-6.563%2c2.005-6.563%2c6.2v2.917c0%2c4.193.839%2c6.2%2c6.563%2c6.2S1424.953%2c269.937%2c1424.953%2c265.744Z' transform='translate(-1387.58 -251.523)'%3e%3c/path%3e%3cpath d='M1485.684%2c274.489c-5.47%2c0-7.657-2.553-7.657-8.022V255.893h1.823v9.48c0%2c5.834%2c1.641%2c7.293%2c6.381%2c7.293%2c5.469%2c0%2c6.381-2.37%2c6.381-7.293v-9.48h1.823v18.231H1492.8l-.006-2.917C1492.43%2c273.031%2c1490.06%2c274.489%2c1485.684%2c274.489Z' transform='translate(-1432.815 -252.247)'%3e%3c/path%3e%3cpath d='M1612.443%2c265.744v-2.917c0-5.287%2c1.823-8.022%2c8.386-8.022s8.386%2c2.735%2c8.386%2c8.022v2.917c0%2c5.469-1.823%2c8.022-8.386%2c8.022S1612.443%2c271.213%2c1612.443%2c265.744Zm14.95%2c0v-2.917c0-4.193-.839-6.2-6.563-6.2s-6.563%2c2.005-6.563%2c6.2v2.917c0%2c4.193.839%2c6.2%2c6.563%2c6.2S1627.393%2c269.937%2c1627.393%2c265.744Z' transform='translate(-1522.202 -251.523)'%3e%3c/path%3e%3cpath d='M1691.406%2c266.887h-3.646c-5.287%2c0-7.293-2.005-7.293-7.293V245.009h1.823v3.646h9.116v1.823h-9.116v9.115c0%2c4.74%2c1.823%2c5.469%2c5.47%2c5.469h3.646Z' transform='translate(-1567.438 -245.009)'%3e%3c/path%3e%3cpath d='M1553.711%2c263.374c-4.3-.511-6.381-1.276-6.381-3.647%2c0-2.188%2c1.385-3.1%2c6.381-3.1%2c4.708%2c0%2c6.088.785%2c6.334%2c3.094h1.849c-.211-3.154-2.32-4.917-8.184-4.917-5.944%2c0-8.2%2c1.823-8.2%2c4.922%2c0%2c3.464%2c1.75%2c4.776%2c8.2%2c5.469%2c4.558.547%2c6.746%2c1.276%2c6.746%2c3.646%2c0%2c2.188-1.458%2c3.1-6.746%2c3.1-4.726%2c0-6.1-.82-6.337-3.129h-1.849c.2%2c3.175%2c2.3%2c4.952%2c8.186%2c4.952%2c6.2%2c0%2c8.569-1.823%2c8.569-4.923C1562.28%2c265.379%2c1560.457%2c264.1%2c1553.711%2c263.374Z' transform='translate(-1477.69 -251.523)'%3e%3c/path%3e%3c/g%3e%3cg transform='translate(1181.922 226.358)'%3e%3cpath d='M1217.687%2c252.541c-2.679-2.618-7.292-2.512-12.635-2.387-1.225.029-2.491.058-3.8.058-1.631%2c0-3.2-.062-4.71-.122-5.061-.2-9.432-.371-12.031%2c2.127-1.744%2c1.677-2.592%2c4.491-2.592%2c8.6%2c0%2c3.9.832%2c6.608%2c2.544%2c8.28%2c2.679%2c2.618%2c7.292%2c2.512%2c12.635%2c2.387%2c1.225-.029%2c2.492-.058%2c3.8-.058%2c1.631%2c0%2c3.2.062%2c4.71.122%2c1.339.053%2c2.629.1%2c3.852.1%2c3.4%2c0%2c6.268-.393%2c8.179-2.23%2c1.744-1.677%2c2.592-4.491%2c2.592-8.6C1220.231%2c256.921%2c1219.4%2c254.213%2c1217.687%2c252.541Zm-.487%2c16.427c-2.4%2c2.311-6.448%2c2.151-11.567%2c1.95-1.52-.06-3.091-.122-4.734-.122-1.314%2c0-2.584.029-3.813.058-5.413.125-9.688.224-12.177-2.207-1.583-1.547-2.353-4.107-2.353-7.827%2c0-3.931.784-6.6%2c2.4-8.147%2c2.4-2.311%2c6.449-2.151%2c11.566-1.95%2c1.52.06%2c3.092.122%2c4.735.122%2c1.313%2c0%2c2.584-.029%2c3.813-.058%2c5.413-.125%2c9.689-.224%2c12.178%2c2.207%2c1.583%2c1.547%2c2.353%2c4.106%2c2.353%2c7.826C1219.6%2c264.751%2c1218.813%2c267.416%2c1217.2%2c268.967Z' transform='translate(-1181.922 -242.071)'%3e%3c/path%3e%3cpath d='M1218.583%2c245.08c-2.516-1.721-6.148-2.523-11.431-2.523-8.279%2c0-16.361%2c1.028-16.361%2c13.322%2c0%2c5.161%2c1.5%2c8.694%2c4.574%2c10.8%2c2.516%2c1.721%2c6.148%2c2.523%2c11.431%2c2.523%2c8.279%2c0%2c16.361-1.028%2c16.361-13.323C1223.158%2c250.718%2c1221.661%2c247.186%2c1218.583%2c245.08ZM1206.8%2c268.569c-7.984%2c0-15.372-1.538-15.372-12.69%2c0-11.718%2c7.44-12.689%2c15.728-12.689%2c7.984%2c0%2c15.372%2c1.538%2c15.372%2c12.689C1222.524%2c267.6%2c1215.085%2c268.569%2c1206.8%2c268.569Z' transform='translate(-1187.82 -237.13)'%3e%3c/path%3e%3cpath d='M1213.049%2c234.457c-8.134%2c0-13.39%2c6.294-13.39%2c16.035%2c0%2c9.592%2c5.238%2c16.036%2c13.035%2c16.036%2c8.134%2c0%2c13.39-6.294%2c13.39-16.036C1226.084%2c240.9%2c1220.846%2c234.457%2c1213.049%2c234.457Zm-.356%2c31.438c-7.418%2c0-12.4-6.19-12.4-15.4%2c0-9.357%2c5.007-15.4%2c12.757-15.4%2c7.417%2c0%2c12.4%2c6.19%2c12.4%2c15.4C1225.45%2c259.849%2c1220.443%2c265.9%2c1212.694%2c265.9Z' transform='translate(-1193.717 -231.744)'%3e%3c/path%3e%3cpath d='M1218.947%2c226.358c-2.817%2c0-5.479%2c2.157-7.5%2c6.073a28.572%2c28.572%2c0%2c0%2c0-2.922%2c12.675c0%2c7.663%2c3.584%2c18.75%2c10.063%2c18.75%2c2.817%2c0%2c5.479-2.157%2c7.5-6.074a28.567%2c28.567%2c0%2c0%2c0%2c2.923-12.676C1229.011%2c237.444%2c1225.427%2c226.358%2c1218.947%2c226.358Zm-.356%2c36.865c-2.636%2c0-5.083-2.16-6.889-6.082a30.227%2c30.227%2c0%2c0%2c1-2.541-12.034c0-8.551%2c4.185-18.116%2c9.786-18.116%2c2.636%2c0%2c5.083%2c2.16%2c6.889%2c6.083a30.219%2c30.219%2c0%2c0%2c1%2c2.542%2c12.033C1228.378%2c253.658%2c1224.192%2c263.223%2c1218.591%2c263.223Z' transform='translate(-1199.615 -226.358)'%3e%3c/path%3e%3c/g%3e%3c/g%3e%3c/svg%3e)
Data Upload
Gives users a way to bring their own data onto the platform. For each time series users wish to use with the platform, users will need to upload it using this tool. Once uploaded, use the data all across Chronos, like using it in a forecast or as the base series in a new scenario.

Before Uploading
Preparing Data
In order to make a forecast using algorithms, data is required. There are various styles of organizing time series data but here Chronos has the requirement for a formatted 'date' column and then other columns containing the series values.
Before uploading the data, it is advisable to manually scan the imported data for errors. Sometimes when data is converted to new formats, the values are truncated or corrupted. Usually looking at a few things, particularly the min, mean, max, and count of the data is sufficient to detect any major problems. Review the data again after upload.
Add metadata to uploads when possible. It is useful for remembering just what that series was when reviewed months later. It is also important to be aware of as much context as possible about the series. Where do these numbers come from?
Two of the harder-to-detect data problems are incomplete recent data and data definition changes. Incomplete recent data is common where data has to be reviewed or is gradually arriving as requests are processed. Incompleteness also occurs based on when a forecast is performed. Performing a monthly forecast mid-month will often draw in incomplete data for the current month, appearing like a drastic and unexpected drop. The solution is usually to adjust the date range to remove the more recent data, or to manually adjust to expectations.
Data definition changes are another frequent challenge. Business units get combined or separated and the resulting data suddenly is much larger or smaller than before. Again there is no automatic approach, and the solution is usually to adjust the date range to drop the data, or to manually adjust the data if possible.
Data format
We currently support .csv and .xlsx file uploads and the primary way for users to bring their own data onto the platform. This is usually the first stop a user makes before starting to use the rest of the platform.
Formatting your data before bringing it on to the platform is essential. We've done as much as we can to accept many different formats and variations of data but this step is none-the-less important. Tools like Excel or Google Sheets are good places to work with your time series data to ensure the formatting is correct. Often there are utilities to transform data all at once so the process should be quick and easy.
Data should look like the tables below: column name "date" must be present, however the "values" column name can be called anything
Daily data
| date | values |
|---|---|
| 2022-01-01 | 42.1 |
| 2022-01-02 | 40.8 |
| 2022-01-03 | 38.6 |
| 2022-01-04 | 42.8 |
| ... | ... |
Monthly data
| date | values |
|---|---|
| 2022-01 | 42.1 |
| 2022-02 | 40.8 |
| 2022-03 | 38.6 |
| 2022-04 | 42.8 |
| ... | ... |
Yearly data
| date | values |
|---|---|
| 2018 | 42.1 |
| 2019 | 40.8 |
| 2020 | 38.6 |
| 2021 | 42.8 |
| ... | ... |
In some cases you'll want to bring in more than one series at a time, for example with Batch forecasting. To specify additional series, add the values as a new column while maintaining a single date column. If the series' date ranges do not line up, that is okay. Include all the dates need and cells where a series doesn't have values can be left blank.
An example of this could look like the following:
Daily data
| date | series_one | series_two |
|---|---|---|
| 2022-01-01 | 42.1 | |
| 2022-01-02 | 40.8 | |
| 2022-01-03 | 38.6 | 115.2 |
| 2022-01-04 | 42.8 | 110.0 |
| 2022-01-05 | 110.0 | |
| 2022-01-06 | 110.0 | |
| ... | ... | ... |
The table above shows multiple series with differing date ranges. series_one spans from 2022-01-01 to 2022-01-04 and series_two spans from 2022-01-03 to 2022-01-06. Chronos will handle these cases without a problem as long as the date frequency of all the series being uploaded is the same. For example, mixing monthly data and daily data will not work.
Preprocessing
Once you've successfully uploaded some data through the file upload process, there are a few preprocessing options available before the final submission of the data.
Transformations
- Remove outliers: In addition to slicing the data as discussed above, other changes can be performed on the data after upload. Outlier removal is straightforward. Particularly large or small data points are removed if they don't appear to follow the pattern of other data points. Sometimes automatic outlier removal can be overly aggressive, but generally outlier removal is a safe bet in cases where predicting the average values (rather than predicting extremes) is the goal.
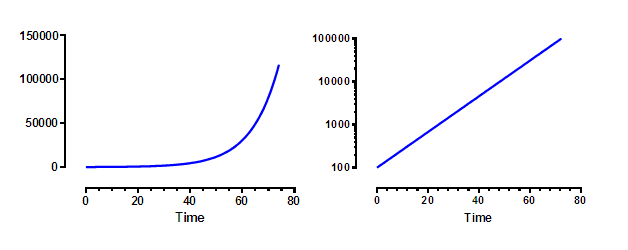
- Convert to log scale: Logs can shift the data to a more linear, more stable series which are commonly used for graphing in scientific publications.Below are two graphs, both showing the same time series but the y-axis on the left is a linear scale while on the right we see the data on a log scale.
- Smoothing: Think of smoothing as a more refined take on outlier removal. It involves reframing each data point as an average of that point and the previous points. No information is lost, but rather changes are more gradually diluted across time. Generally a little bit of smoothing, like 7 step smoothing for daily data, is beneficial for models, essentially preventing the model from overthinking small fluctuations. For short term forecasting and where forecasts are viewed on a highly granular level, with each day examined closely, smoothing is more often avoided. The longer the horizon and more high-level the use of the forecast, then the more smoothing will be beneficial.The chart below shows some example daily data where the effect of 7-day, 30-day, and 90-day smoothing is applied. The greater the smoothing period the greater the smoothness of the data.
- Resampling: A different approach than smoothing, but with a similar goal of attempting to take data that is very random into something that is more stable. Data is aggregated to a higher frequency. Daily data is combined to monthly data. The advantage of this approach is essentially the same concept of the central limit theorem. How well some day, say June 21, does on some value may vary greatly depending on the weather, events, construction, and so on, but which across the entire month of June will see the good and bad days combine to a more stable value. Resampling is also useful for very high frequency data, like hourly data. Higher frequency data is often slower to forecast as well as potentially less accurate, so aggregating to the level at which decisions are based is most practical. Resampling should be avoided when it drastically shortens the training history. Three years of daily history is ample data for most models, but only three data points of the same data resampled to an annual cadence is too little for most models.The chart below shows the same data, this time the transformations applied are resampling from daily to monthly to yearly.
Transformations like converting to log scale should be used with particular attention because they shift the values into a different range. Users have to be aware that the forecast values will need to be shifted back, using an exponential function, to be interpreted in the original space.
Graphs in Chronos will often have a normalize option. Trying to view two related series at once, say an exchange rate with values around 1 and total sales value, with values in the 100,000's, would be impossible on the same graph without normalization as there isn't enough room to give both the necessary resolution. Normalization shifts the values into a range where they can be viewed at the same time without losing the basic shape and pattern.